The hydrological cycle (or the natural water cycle) is often considered to be a rather simple story about water evaporating from the ocean, rain falling on land and rivers taking the water back to the ocean.
But it is not. The water cycle is a more complex system and proper understanding of these complexities is essential to understand the challenges of environmental change (including climate change) and human interference in the fresh water resources on earth.
In this article, we discuss the work of a group of scientists (Abbott et al., 2019b) who analysed the presentation of the water cycle in education, research and policy documents. They linked the many misrepresentations of the hydrological cycle and the many overestimations of sustainably available water resources with a problematic misunderstanding of the challenges to our freshwater resources posed by climate change, human use of land and water, and the failings of water management to offer adequate responses to these challenges.
With this article, we would like to share the conclusion of Abbott et al. (2019b) with a wide audience of educators, policy makers and students. We will also illustrate the misrepresentation of the hydrological cylce with a couple of cases from science and policy, and a we will continue to collect good practices.

(follow this link to the version in Dutch: De waterkringloop in het Antropoceen)
'Figure 7' from the World Water Development Report 2020
The theme of the yearly World Water Development Report for 2020 (WWDR 2020) was "Water and climate change" (UNESCO, UN-Water, 2020). On page 16 of the report, we can read the following lines:
"The earth’s climate and the terrestrial water cycle have a very close and complex relationship (Figure 7). Changes in climate variability and change will therefore propagate to affect water resources."
"At the same time, the hydrological cycle is itself an essential component of the climate system, controlling
the interaction between the atmosphere and the land surface and providing feedback mechanisms for the transport, storage and exchange of mass and energy (Figure 7)".
The 'Figure 7' contains 2 images: a diagram of the earth's water pools and a diagram of the water fluxes. The figure summarizes the findings of an article by 23 authors, which we will refer to as Abbott et al. (2019b). It is both an eye-opener on the impacts of human activity on the future availability of freshwater resources and a summary of the story of fresh water on earth.
The diagrams are very briefly commented upon in the WWDR 2020, which in fact disguises a bit the great importance of their message. To hear that message more clearly, we have to go back to the source.
Human domination of the global water cycle absent from depictions and perceptions
In 'Human domination of the global water cycle absent from depictions and perceptions', Abbott et al. (2019b) reviewed 464 publications on their presentation of the global water cycle.
They concluded that :
- only 15% of water cycle diagrams depict human interaction with water
- 95% of diagrams depict just a single catchment, losing the concept of interconnectivity of different catchment areas
- only 2 per cent of the diagrams made reference to connect the cycle with climate change, water pollution or changes in land cover
- freshwater availability for human use is overrated:
- by not distinguishing saline from freshwater lakes (half of the global lake volume is saline), and by not distinguishing renewable from non-renewable groundwater resources (97% of groundwater must be considered non-renewable)
- by not indicating the proportion of freshwater resources that is accessible for human use: less than 10% of terrestrial percipiation and 25 of annual river flow are sustainable available for human consumptive use and only 5% of fresh groundwater is sustainably extractable
- by excluding grey water (wastewater that is returned into the environment) not only human interaction is further minimised but also pollution diminishes the fraction of sustainably available water resources (water quality) by 30 to 50%.
Such misrepresentations of the global water cycle have consequences. "The water cycle diagram is a central icon of hydro science, but misrepresenting the ways in which humans have influenced this cycle diminishes our awareness of the looming global water crisis", commented Prof. David Hannah, one of the authors of the article, in Science Daily. "By leaving out climate change, human consumption, and changes in land use we are, in effect, creating large gaps in understanding and perception among the public and also among some scientists."
In the article, Abbott et al. (2019b) link inaccuracies of presenting the water cycle to current failings in water management:
- disregard of the hydrological teleconnections between oceans and continents and among catchments has led to attempts to solve water scarcity with single-catchment interventions
- a lack of understanding of short- and long-term temporal change has led to the overallocation of water resources and overdependence on engineered water infrastructures
- water quality and water quantity are often treated as separate issues due to technical, legal and disciplinary differences
- much of current water management focuses on securing water supply rather than managing water demand
Based on their research and data collected from the different publications, the authors then drew a new diagram for "the water cycle for the Anthropocene". That was the basis for the Figure 7a and 7b (below) that were published in the WWDR 2020:
 Water pools (figure 7a, from UNESCO, UN-Water, 2020, 17)
(uncertainty represents the range of estimates)
 Water fluxes (figure 7b, from UNESCO, UN-Water, 2020, 17)
(uncertainty represents the range of recent estimates)
Some remarkable conclusions from the the water cycle for the Anthropocene
- The importance of the terretrial water cycle: evapotranspiration of green water and evaporation of blue water are more important than the evaporation from the oceans (60% land vs 40% oceans) for percipitation on the land surface. Green water stands for 65-70% of the percipitation in the terrestrial water cycle.
- Our present level of use of blue water (4,000 km3 ± 30%, which is 2,800 to 5,200 km3) approaches the sustainable available amount of 5,000 to 9,000 km3 - especially when discharge of grey water and pollution is taken into consideration). 90% of this sustainable available amount is groundwater.
- Humans have become a fundamental part of the water cycle. A water cycle that leaves out human interference, does not exist any more.
Since the beginning of the Industrial Revolution, human activity fundamentally changed the earth's atmosphere, biosphere, water cycle, biodiversity and land surface. Hence the reference by Paul Crutzen to the Anthropocene as new epoch in the geological history of the world.
Changes in e.g. land cover (deforestation, draining wetlands, urbanisation) impact evapotranspiration of plants, trees and soil, which in turn will impact precipitation and available water resources elsewhere on land. This will then affect future availability of green water use for human development (now 19,000 km3 ± 20%) - especially in agriculture. Substituting diminished green water will be extremely difficult.
Uncertainty and the knowledge gap
The figures in the diagrams above on water volumes in fluxes and pools also include a certain uncertainty (the ± X%). This uncertainty represents the range of estimates of volumes that were found by Abbott et al. in their synthesis of about 80 recent regional- and global-scale studies (see supplementary table 1 for the detailed estimates).
The authors conclude that recent studies show that the estimation of the volumes of water fluxes and water pools need to be revised. The volumes of sustainably available freshwater and renewable groundwater have been overestimated in the past and "substantial uncertainty persisted for several pools and fluxes critical to societal and ecological water needs, including groundwater, soil moisture, water in permafrost and groundwater discharge to the ocean".
This is an important conclusion for policy makers. Accurate and reliable data are essential to understand the real scope and challenges posed by human activity and environmental change. Wrong depictions may lead to underestimating these challenges or interventions that do not address the real problems.
Additionally, according to the 2018 World Bank 'Assessment of the State of Hydrological Services in Developing Countries', only 7% of countries surveyed in the report had adequate water-related monitoring systems, while only 2% of the providers of hydrological services had full knowledge of user needs. This is one of the reasons why the UN, as part of measuring progress on the Sustainable Development Goals, is putting so much stress on the need for data collection to fill the knowledge gaps.
Misrepresenting the hydrological cycle
A quick search on the internet on the presentation of the global water cycle show us the concerns expressed by Abbot et al. about the misrepresentation of the water cycle.
Below, we briefly discuss 3 interesting cases.
The first one is also used by Abbott et al. and comes from a scientific insititution: the United States Geological Survey. On its Water Science School website, the image below is presented as a presentation of the "natural water cyclus" for adults and advanced students:
 Misrepresenting the water cycle: example from: The Water Cycle, from United States Geological Survey Water Science School website.
We see arrows of evaporation and evapotranspiration pointing up from the sea, freshwater lakes and land. But overall the big circular movement from oceans to land and back through the soil suggest that the sea is the main driver for percipitation on land. There are no indications of volumes of water pools and fluxes, or distinctions of saline and freshwater pools (lakes, groundwater).
This version of the diagram mentions that the significant impacts of human influence are ommitted - and one would wonder why, with 77% of the land surface being disturbed by human activity. Pretending that humans are absent from earth does not help visitors of the Water Science School website to understand the water cycle and its challenges in the Anthropocene. Especially since many other websites have adapted this diagram, relying on the reputation of the USGS as a scientific institution (see examples in this Google search).
A second case comes from a policy document by the European Environment Agency, an agency "whose task is to provide sound, independent information on the environment" to support policies and decision making.
In an article in a Signal series on water and life, the following water cycle diagram is presented (its title is "Water cycle — Main issues affecting water quality and quantity"):
 Misrepresenting the water cycle: example from Water cycle — Main issues affecting water quality and quantity, from EEA 2018.
In this diagram, we see a lot of human interference, especially affecting water quality. The presentation of the natural water cycle is very abstract, with some hints of natural fluxes but without specific water pools, available water resources. Human alteration of physical water bodies include a dam, an irrigation system and a canal. Water withdrawal is only mentioned as over exploitation of groundwater (and something also happens in the sea). Agriculture, the human activity that consumes most water world wide and is a major pollutor of surface water in many European countries, is almost absent in the diagram. Climate change hangs in a cloud; a good presenation of the impact of environmental change on evapotranspiration and percipitation patterns is missing. For the purpose of the article, this diagram does not properly illustrate the issues at hand - and it is definitely not a presentation of the water cycle as it claims to be.
A third case comes from The state of food and agriculture 2020, the annual report of the Food and Agriculture Organisation (FAO). The 2020 issue was entirely dedicated to "Overcoming water challenges in agriculture". The image below is from page 6 of the report, as part of a section on human pressure and water availability.
 Misrepresenting the water cycle: 'The hydrological cycle', from FAO 2020.
The diagram claims to explain the hydrological cycle and agriculture. What we see is simple cycle, a single catchment, one river, one lake, green soil, only fresh groundwater. We don't find any information on water availability or water quality.
The Garden of Eden may have looked like that at the end of the third day. There are no humans around and there is certainly no agriculture. It does not reflect what human pressures mean for fresh water resources. No withdrawal for irrigation, no green water needs, no agricultural drainage (nutrients, pesticides, and other pollutants) that returns to the surface water or seeps into the ground.
Human domination of the global water cycle
On this web page, we will collect cases of good presentations of the water cycle in the Anthropocene. Educators and future designers of water cycle diagrams may find inspiration and good practices for telling the story of freshwater resources in the world; policy makers may get a better understanding of the challenges of water resources in the Anthropocene.
We start with a visualisation from the publication by Abbott et al. (2019b) themselves.
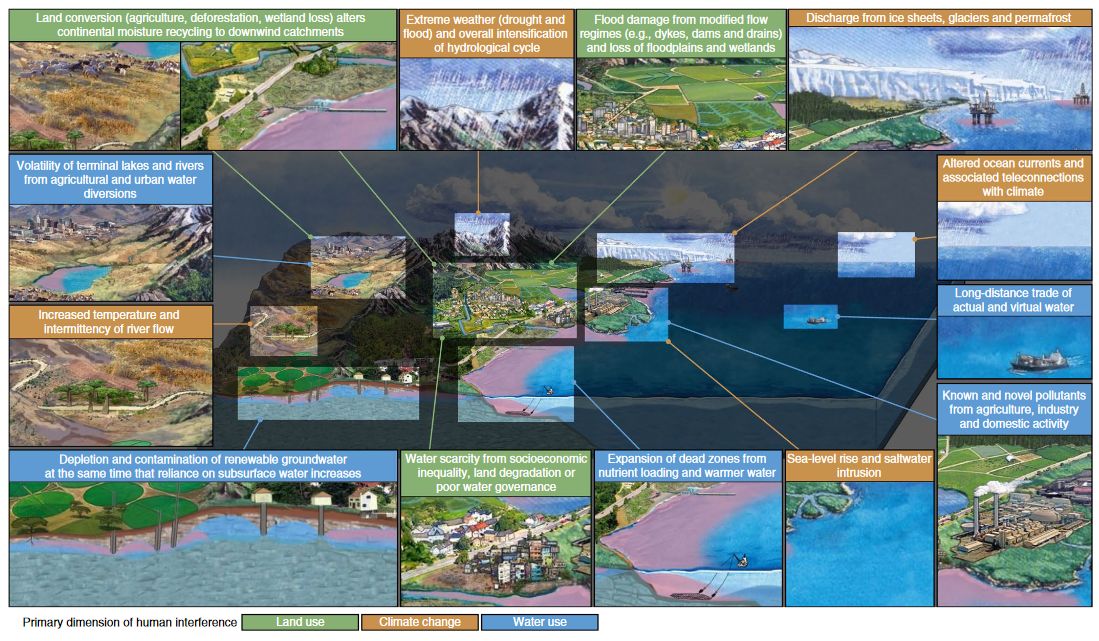
This is figure 4 from their article: "Some consequences of human interference with the water cycle". They took their own diagram (the one that was the basis for 'Figure 7') and added information on causes that influence the global water cycle.
And on the English Wikipedia pages on the "Water cycle", a diagram is featured based on Abbott et al.:
 Water cycle diagram by Leslie Lange and Anna Wright (?)
This water cycle diagram by Leslie Lange and adapted many elements from the Abbott et al. recommendations.
In its presentation, it integrates water pools and fluxes data. Figures are presented as percentages of total water amounts, which make it not always easy to understand their relative importance, especially for water resources on land. Human water use is visualised as pollution, various actvities (like leisure, fishing, oil drilling and irrigation) and in a text box.
References
- Abbott B., Bishop K., Zarnetske J., et al., 2019a. A water cycle for the Anthropocene. Hydrological Processes, 33: 3046– 3052. https://doi.org/10.1002/hyp.13544
- Abbott B., Bishop K., Zarnetske J. et al., 2019b. Human domination of the global water cycle absent from depictions and perceptions. Nature Geoscience, 12, 7: 533–540. https://doi.org/10.1038/s41561-019-0374-y and https://aquadoc.typepad.com/files/s41561-019-0374-y.pdf
- UNESCO, UN-Water, 2020. United Nations World Water Development Report 2020: Water and Climate Change, Paris, UNESCO.
- World Bank, 2018. Assessment of the State of Hydrological Services in Developing Countries. Washington, World Bank Group.
Web pages
- EEA, Signals 2018: Clean water is life, health, food, leisure, energy…. Last visited on 31/03/2021.
- FAO 2020, The State of Food and Agriculture 2020: overcoming water challenges in agriculture. FAO, Rome. Last visited on 31/03/2021.
- Science Daily, Our water cycle diagrams give a false sense of water security, 10/06/2019. Last visited on 31/03/2021.
- UN Water, UN-Water Integrated Monitoring Initiative for Sustainable Development Goal 6: 20202 data drive. Last visited on 31/03/2021.
- United States Geological Survey, Water Science School: the water cycle for adults and advanced students. Last visited on 31/03/2021.
About the Anthropocene
- Anthropocene Magazine. The Anthropocene: Paul Crutzen’s epochal legacy. Last visited on 31/03/2021.
- Age of Man: enter the Anthropocene. National Geographic. Last visited on 04/05/2021.
- Polar drift in the 1990s explained by terrestrial water storage changes