During the past 3 decades of various global sustainable development action plans (with Agenda 21 in 1992, the Millennium Development Goals from 2000 to2015, and now the Agenda 2030 with the Sustainable Development), the hardest thing proved to target the 'marginalized groups' in society (see: World’s most marginalized still left behind by global development priorities: UNDP report).
Including marginalized groups sounds like an oxymoron. But "Everyone must benefit" is now the central promise of the 2030 Agenda for Sustainable Development, aiming especially at these marginalised groups that are so easily left behind.
If we translate this promise into water language, it sounds like "Water for All". On March 22, World Water Day 2019 highlights the importance of special attention to marginalized groups – women, children, refugees, indigenous peoples, disabled people and many others – "that are often overlooked, and sometimes face discrimination, as they try to access and manage the safe water they need" (to quote from the UN-Water website).
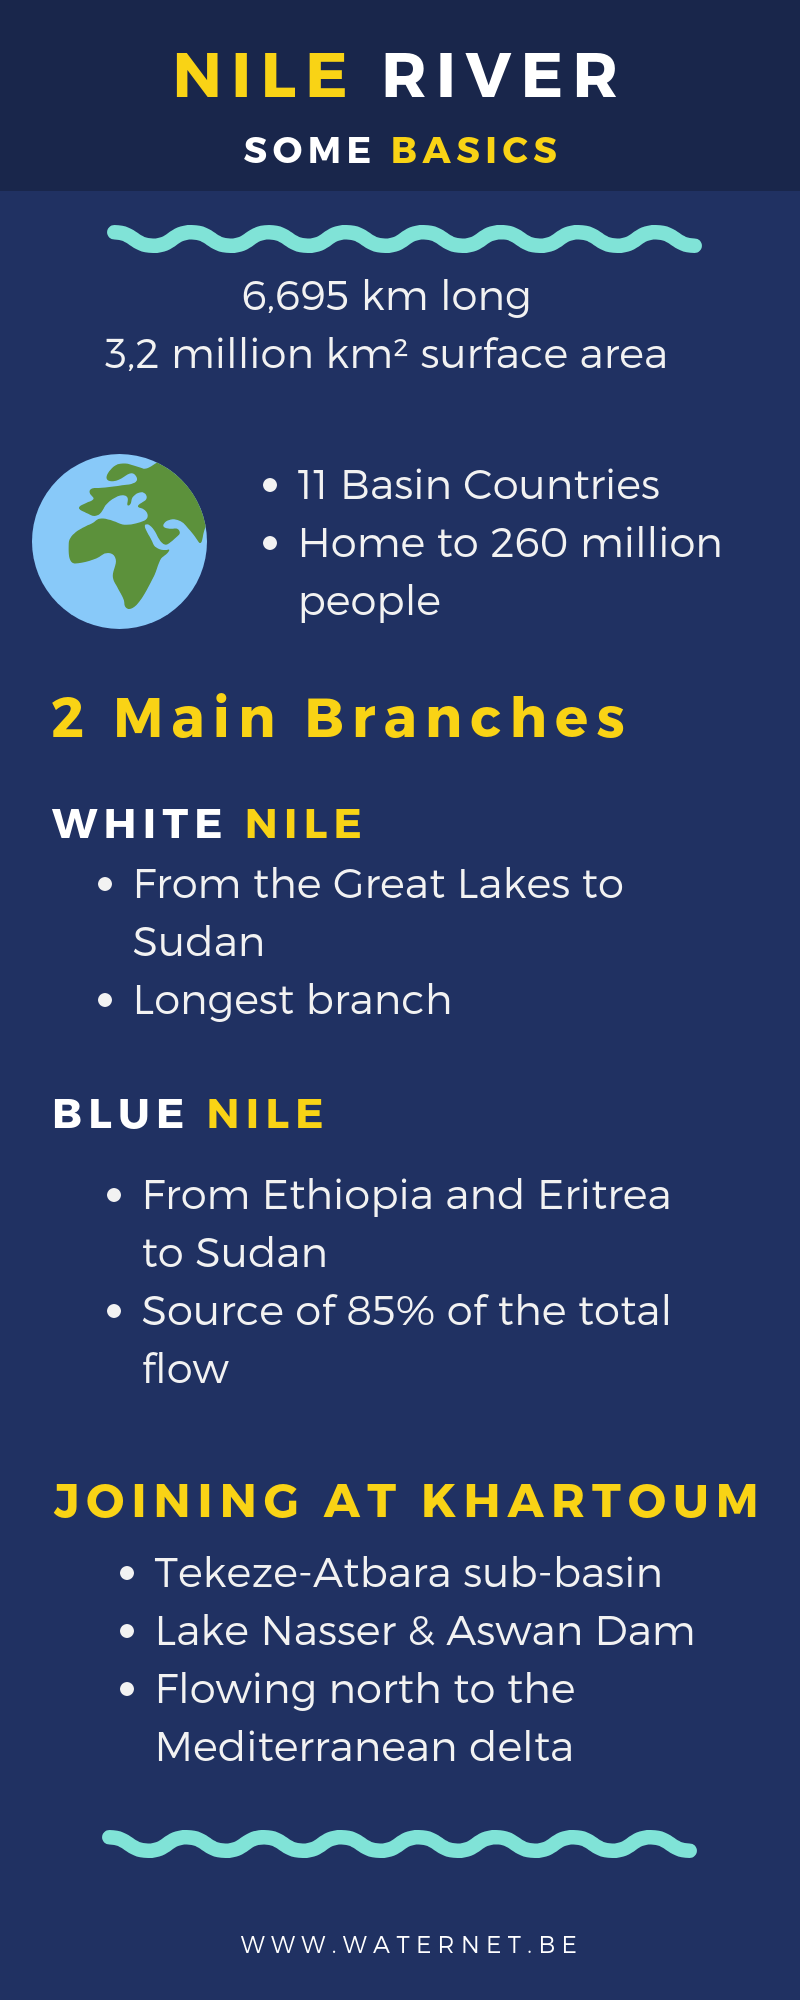
As part of the Nile River section of this website, we have collected some data related to access to drinking water, sanitation and hygiene in the Nile River basin.
Access to basic services: an overview
Table 1: Access to drinking water, sanitation and hygiene.
Basic access to drinking water = within a distance of fewer than 30 minutes
Basic access to sanitation = private units
Basic hygiene = presence of water and soap
Source: WHO/UNICEF (2017) Progress on Drinking Water, Sanitation and Hygiene: 2017 Update and SDG baseline; World Bank (2017) World Development Indicators.
Access to basic water services: the rural-urban divide
Table 2: Basic access to drinking water: safe water within a distance of fewer than 30 minutes
Source: WHO/UNICEF (2017) Progress on Drinking Water, Sanitation and Hygiene: 2017 Update and SDG baseline
Household access to drinking water services: piped vs non-piped vs no access
Table 3: Basic access to drinking water: piped, non-piped and no access (safe water within a distance of fewer than 30 minutes)
Source: WHO/UNICEF, Joint Monitoring Programme. Data from 2015.
Access to basic services for school children
Table 4: Access to basic drinking water, sanitation and hygiene services for school children
Basic access to drinking water = within a distance of fewer than 30 minutes
Basic access to sanitation = private units
Basic hygiene = presence of water and soap
Source: WHO/UNICEF (2018) Drinking water, sanitation and hygiene in schools: Global baseline report 2018.